Outdated FEMA Flood Maps: How Drone LiDAR Protects Cities
March 18, 2026
If you work in municipal public works or city engineering, there is a good chance your jurisdiction's flood risk decisions are based on elevation data collected before most of your current infrastructure was built.
FEMA's National Flood Insurance Program maps — the regulatory standard for flood zone designation, insurance requirements, and development permitting — rely on terrain models that are often 10, 20, or even 30 years old. In many communities, the underlying elevation data was collected using aerial photogrammetry methods from an era when a 2-foot contour interval was considered state of the art.
The gap between what those maps show and what actually happens when it rains is growing wider every year.
The Problem with Legacy Flood Data
Flood mapping is fundamentally a terrain problem. Water flows downhill, collects in depressions, and concentrates along channels. The accuracy of any flood model depends entirely on the accuracy of the terrain data feeding it.
FEMA's effective flood maps for many communities were developed using terrain data with 2-foot (60 cm) vertical accuracy at best. In flat or gently sloping areas — exactly the areas most vulnerable to flooding — a 60-centimeter margin of error can mean the difference between a property being in or out of a flood zone.
Since those maps were drawn, the landscape has changed. New subdivisions alter drainage patterns. Commercial development increases impervious surface area. Infrastructure ages and capacity degrades. Climate patterns shift, delivering more intense precipitation events to systems designed for historical rainfall.
The maps don't reflect any of this.
What Drone LiDAR Changes
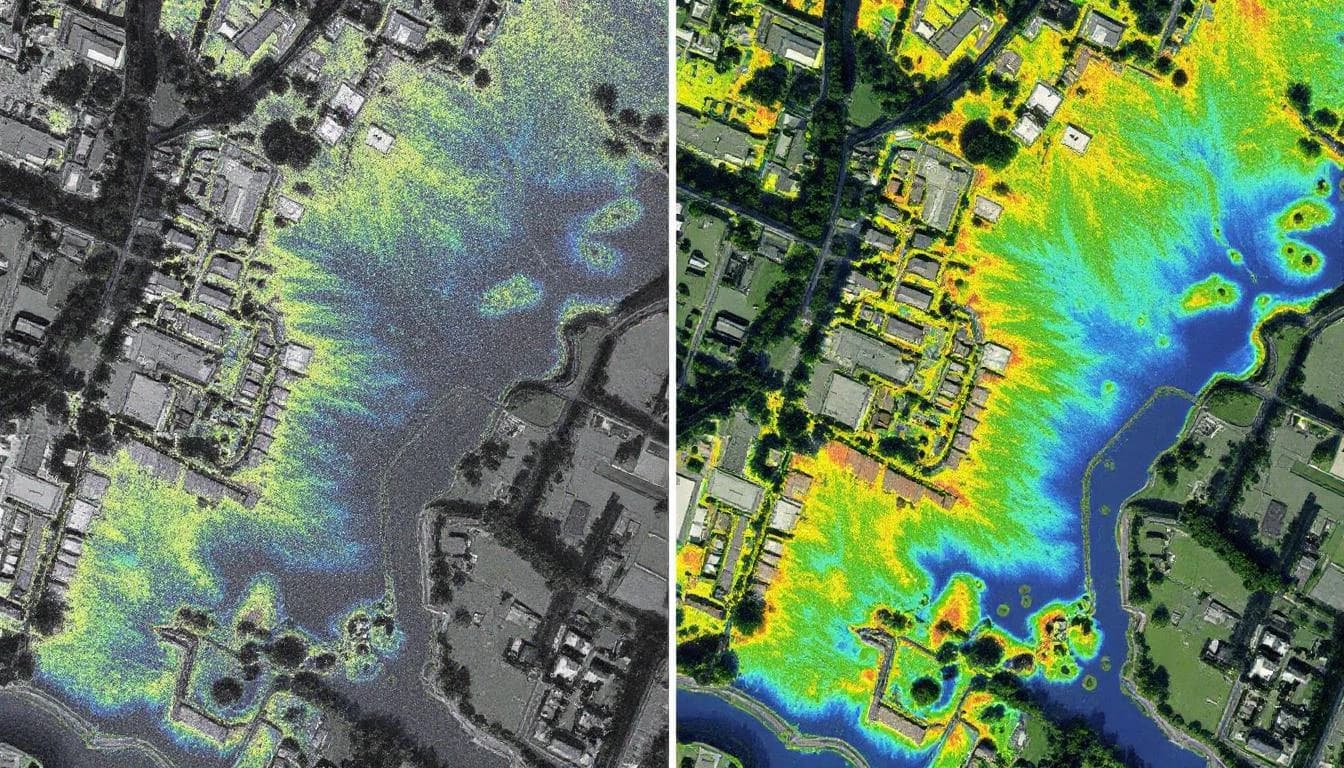
Drone-based LiDAR scanning captures terrain elevation at sub-5-centimeter vertical accuracy — roughly 10 to 12 times more precise than the data underlying most existing FEMA maps. At this resolution, the terrain model reveals drainage features that are invisible in coarser data: swales between properties, subtle grade changes along streets, backyard depressions that collect runoff from surrounding lots.
More importantly, drone LiDAR captures the terrain as it exists today — with all the grading changes, fill placement, and infrastructure modifications that have occurred since the last official survey.
When this high-resolution terrain data is used as the input for hydrological modeling and rainfall simulation, the results frequently contradict the official flood maps. Areas designated as low risk turn out to have concentrated flow paths. Properties outside the regulatory flood zone sit in localized depressions that collect upstream runoff. Drainage infrastructure assumed to be adequate proves undersized when modeled against the actual contributing drainage area.
How Municipalities Are Using This Data
Progressive cities and counties are not waiting for FEMA to update their maps. They are commissioning their own high-resolution terrain data and using it for practical, immediate improvements to flood risk management.
Stormwater master planning. Multiple jurisdictions have replaced their legacy terrain data with drone LiDAR-derived DEMs for system-wide stormwater modeling. The updated models identify capacity bottlenecks, locate areas where development has outpaced drainage infrastructure, and prioritize capital improvement projects based on actual flood risk rather than outdated designations.
Pre-construction drainage review. Some cities now require or encourage drone LiDAR surveys as part of the site plan review process for new development. When the city has access to high-resolution terrain data surrounding a development site, engineers can model how new construction will affect drainage patterns on neighboring properties — before approving the permit, not after complaints start arriving.
Infrastructure condition assessment. LiDAR-derived terrain models, combined with storm sewer system data, allow engineers to evaluate whether existing infrastructure has adequate capacity for current and projected conditions. This is particularly valuable for aging systems where the original design assumptions may no longer apply.
Grant application support. FEMA's Building Resilient Infrastructure and Communities (BRIC) program and Hazard Mitigation Grant Program (HMGP) both fund projects that reduce future disaster costs. Applications that include high-resolution terrain data and physics-based flood modeling consistently score better than those relying on qualitative risk descriptions.
The Phased Approach
Most municipalities cannot afford to scan their entire jurisdiction in a single project, nor do they need to. The practical approach is phased coverage prioritized by risk:
Phase 1: Known problem areas. Start with neighborhoods or corridors where drainage complaints are frequent, where flooding has caused documented property damage, or where capital improvement projects are already planned. Scanning 1 to 5 square miles of high-priority area provides immediate value for ongoing engineering work.
Phase 2: Development pressure zones. Extend coverage to areas experiencing rapid development or redevelopment. These are the zones where drainage patterns are changing fastest and where proactive data collection prevents reactive crisis management.
Phase 3: System-wide coverage. As budget allows, expand coverage to create a jurisdiction-wide digital elevation model that supports comprehensive stormwater modeling, long-range infrastructure planning, and regulatory updates.
Each phase produces standalone value. The data from Phase 1 doesn't depend on Phase 2 to be useful. And each phase's data remains valid for years — terrain changes slowly in developed areas.
Cost Considerations
Drone LiDAR scanning for municipal applications typically ranges from $800 to $2,500 per square mile, depending on terrain complexity, vegetation density, and required ground control. For context, a typical Phase 1 project covering 3 square miles of a flood-prone area costs roughly the same as a single residential flood damage claim.
The return on investment is measurable. When drainage improvements are designed using accurate terrain data, they solve the actual problem the first time. This eliminates the redesign-and-rebuild cycle that plagues projects built on bad data — a cycle that can double or triple the effective cost of infrastructure improvements.
Multiple funding mechanisms exist to offset the cost. FEMA BRIC and HMGP grants explicitly fund data collection for hazard mitigation planning. State revolving loan funds may cover stormwater infrastructure assessment. Some states have dedicated water management grant programs that include survey and data costs.
What Your Jurisdiction Receives
A municipal LiDAR project delivers a standardized set of terrain data products:
Classified point cloud — the raw LiDAR data with every return classified as ground, vegetation, building, or other surface type. This is the foundational dataset that supports all derived products.
Digital elevation model — a continuous surface representing bare-earth elevation across the scanned area. This is the primary input for all hydrological modeling.
Contour lines — elevation contours at any desired interval (typically 1-foot or 0.5-foot for municipal applications). These can be loaded directly into CAD and GIS systems for engineering design.
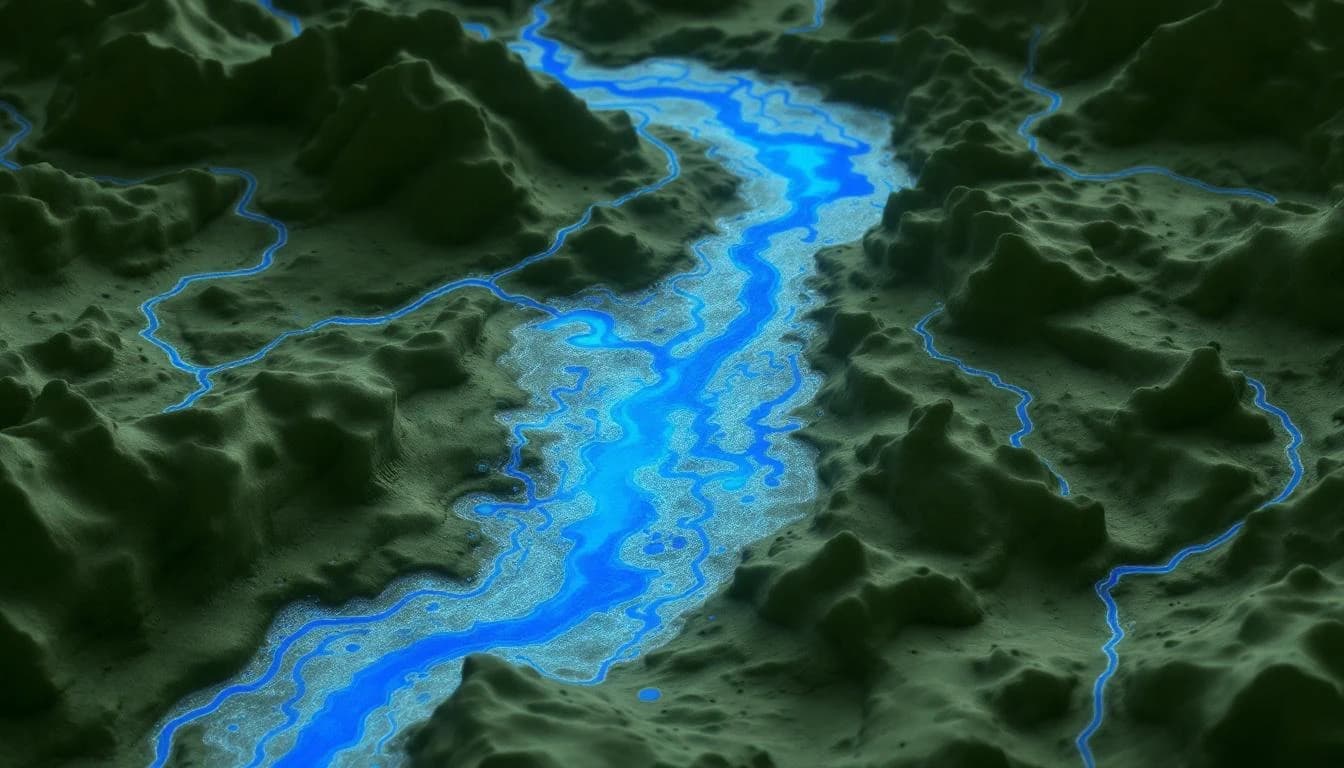
Flow analysis — computed flow direction, flow accumulation, and watershed delineation showing how water moves across the terrain. This identifies contributing drainage areas, flow concentration points, and natural drainage divides.
Rainfall simulation (optional but recommended) — dynamic modeling of water behavior during a design storm event, showing where flooding occurs, how deep it gets, and how long it persists. This is the most powerful tool for communicating flood risk to elected officials, residents, and regulatory agencies.
Making the Case Internally
For public works directors and city engineers who recognize the value of updated terrain data, the challenge is often internal: convincing a city council or county board to fund it.
The most effective approach frames the investment in terms of avoided costs. Every municipality has a recent flood event, a drainage complaint hotspot, or a capital project where bad data caused a redesign. Quantifying those costs — rework dollars, emergency response expenses, insurance claims, resident compensation — and comparing them to the cost of proactive data collection makes a compelling budget argument.
Pairing the scan with an active capital improvement project is another effective strategy. If the city is already planning a drainage improvement in a flood-prone area, adding a LiDAR survey to the project scope is a marginal cost increase that dramatically improves design quality and reduces construction risk.
The Standard Is Shifting
As more jurisdictions adopt drone LiDAR for flood risk management, it is becoming the expected standard rather than an innovative luxury. Engineering firms are increasingly recommending high-resolution terrain data as a prerequisite for responsible drainage design. Insurance companies are exploring the use of LiDAR-quality terrain data for more accurate flood risk assessment. And FEMA itself is moving toward higher-resolution terrain requirements for future map updates.
Cities that invest in this data now are not just solving today's drainage problems — they are positioning themselves ahead of regulatory requirements that are clearly moving in this direction.