How LiDAR Data Is Processed: From Drone Flight to Deliverables
February 11, 2026

When a drone LiDAR mission ends and the aircraft is packed away, the real work begins. The sensor has captured tens of millions — sometimes hundreds of millions — of individual measurements. Each one is a laser pulse that bounced off something and returned to the sensor, carrying information about distance, intensity, angle, and timestamp.
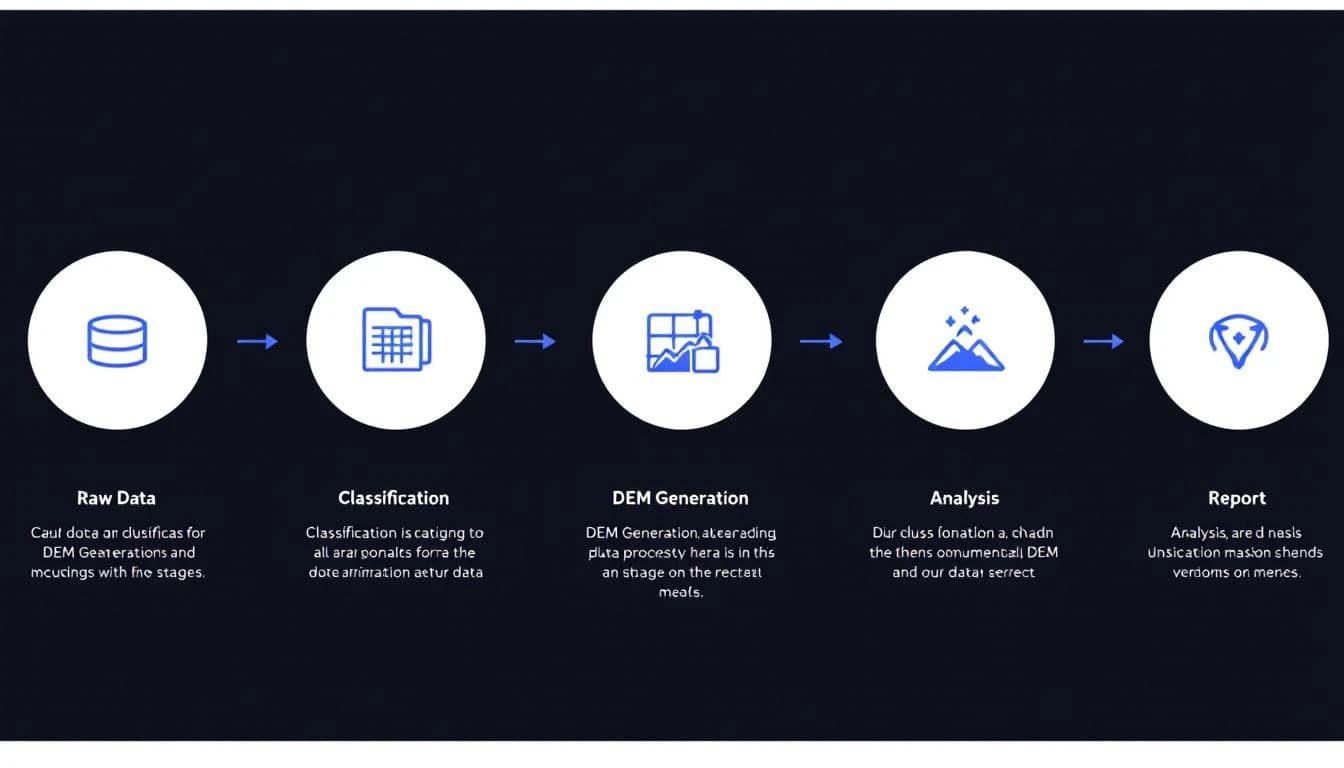
Transforming this raw data into the maps, models, and recommendations that clients actually use requires a multi-stage processing pipeline that combines automated computation with expert analysis. This article walks through that pipeline, stage by stage, so you know exactly what happens between the flight and the deliverable.
Stage 1: Data Download and Quality Check
The first step is mundane but critical: transferring the raw data from the drone's onboard storage and verifying its integrity.
Raw LiDAR data arrives as a series of scan files paired with trajectory data — the continuous record of the drone's position and orientation during flight. These must match: every laser measurement needs to be paired with the exact aircraft position at the moment it was fired.
The initial quality check verifies:
If any of these checks fail, the issue is flagged before processing proceeds. In some cases, a partial re-flight is needed. Better to discover this on day one than to process a dataset with a gap that invalidates the results.
Stage 2: Georeferencing and Strip Adjustment
Each laser measurement starts as a relative distance and angle from the sensor. Converting these into absolute XYZ coordinates on the Earth's surface requires precise knowledge of where the sensor was and how it was oriented at each moment.
This is where RTK/PPK positioning earns its value. The drone's onboard GNSS receiver, corrected using base station data, provides centimeter-accurate position data at each measurement epoch. The inertial measurement unit (IMU) provides orientation (roll, pitch, heading). Combined, these allow every laser return to be projected to its true ground coordinate.
Strip adjustment is the next step: aligning overlapping flight lines so that the same ground features appear at the same coordinates in adjacent strips. Even with RTK positioning, small systematic offsets can exist between strips. Strip adjustment corrects these, ensuring geometric consistency across the entire dataset.
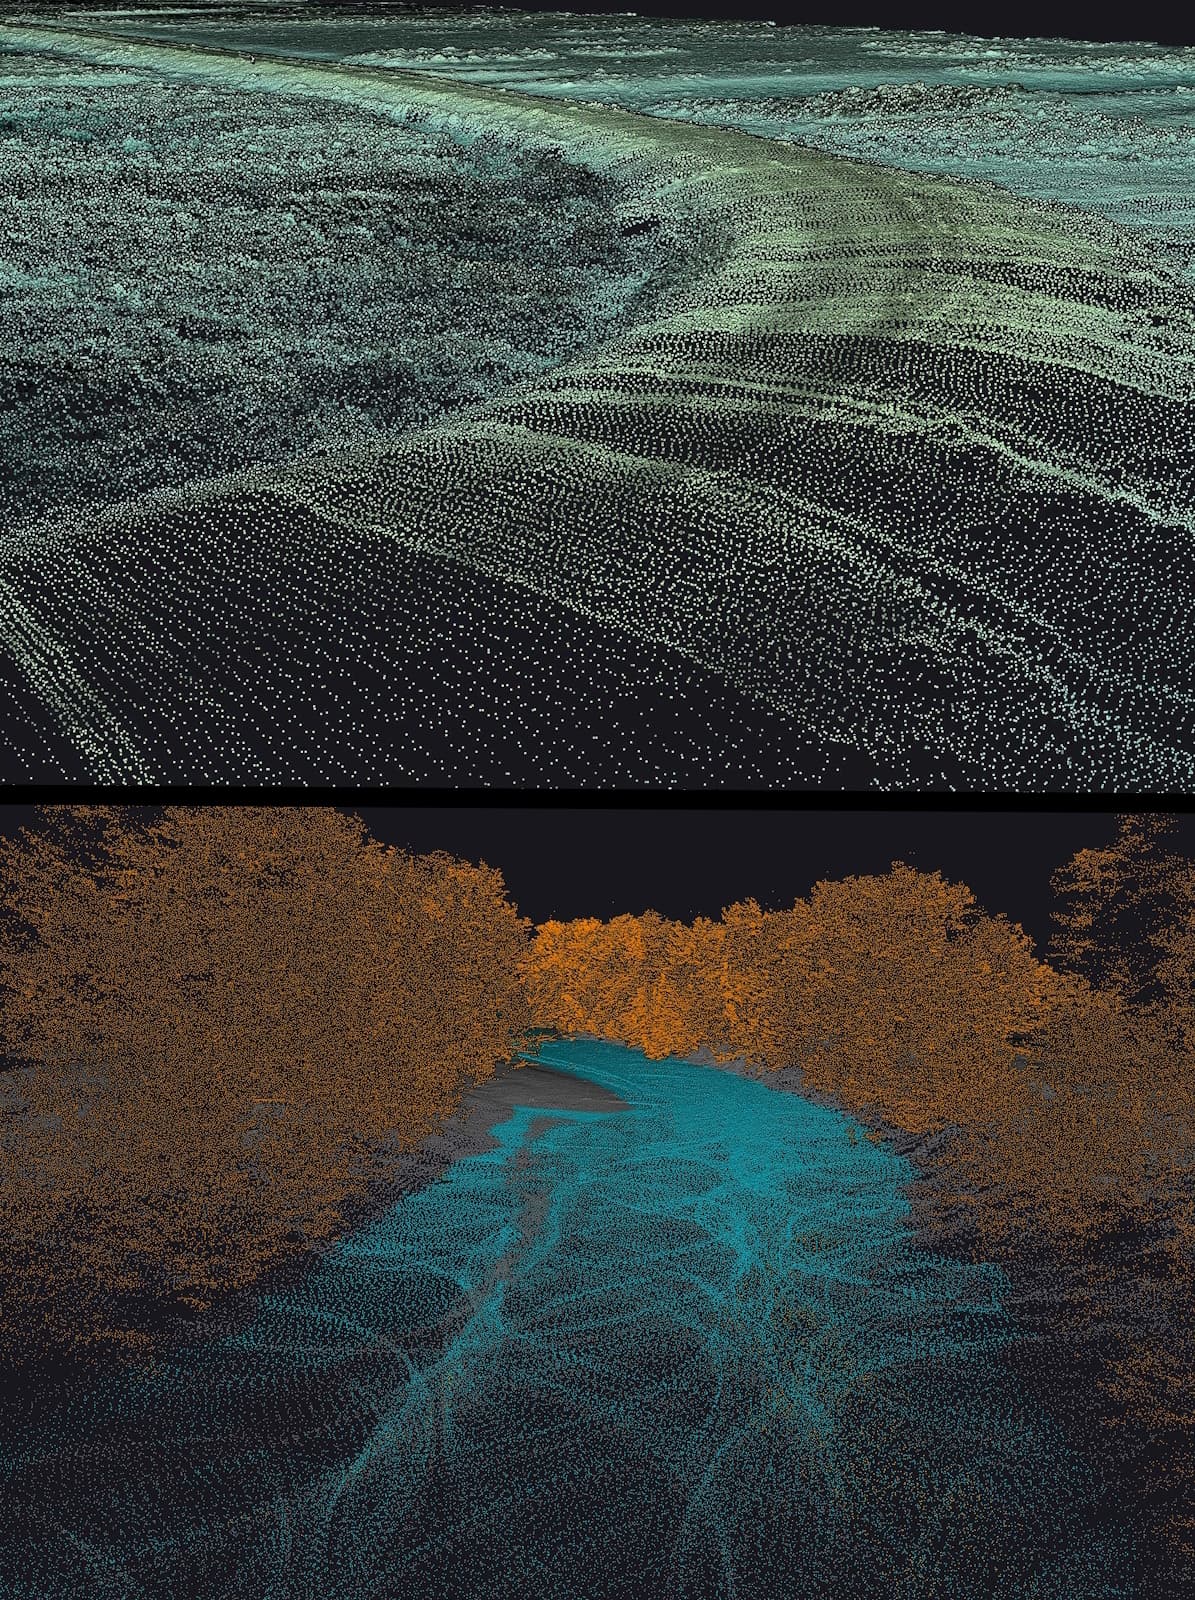
Stage 3: Point Cloud Classification
The raw, georeferenced point cloud contains returns from every surface the laser encountered: bare ground, grass, shrubs, trees, buildings, vehicles, fences, and power lines. For terrain analysis, the ground returns must be separated from everything else.
Classification algorithms analyze the geometric relationships between neighboring points to assign each return to a category:
Ground: Points that lie on the bare earth surface. The algorithm identifies the lowest local surface consistent with natural terrain morphology.
Low, medium, and high vegetation: Returns from vegetative cover at different heights above ground. The height thresholds are configurable — typically 0.5m, 2m, and 5m above ground.
Buildings and structures: Points that form planar surfaces elevated above ground level, consistent with artificial structures.
Noise: Isolated points that are clearly erroneous — returns from birds, dust, multipath reflections, or sensor artifacts.
Automated classification is a starting point. Every dataset undergoes manual review to correct misclassifications, particularly in areas where terrain and vegetation interact in complex ways: steep slopes with overhanging vegetation, terrain breaks near buildings, and areas with dense ground cover.
The quality of ground classification directly determines the quality of the DEM. It is the single most important processing step and the one where operator expertise has the most impact on the final product. The ASPRS publishes standards for LiDAR classification accuracy that professional providers should meet or exceed.
Stage 4: DEM Generation
With ground points classified, the Digital Elevation Model is generated by interpolating a continuous surface through the ground-classified point cloud.
The interpolation method matters. Simple nearest-neighbor or linear interpolation can produce artifacts near data gaps or in areas with sparse ground returns. More sophisticated methods — natural neighbor interpolation or regularized spline with tension — produce smoother, more physically realistic surfaces.
DEM resolution (pixel size) is chosen based on the ground point density and the intended application. For water management applications, 10 to 25 cm resolution is common when ground point density supports it. Higher resolution captures more terrain detail but produces larger files; lower resolution is appropriate for regional-scale analysis.
The DEM undergoes its own quality check: comparison against independent ground control points not used in processing. The resulting RMSE (Root Mean Square Error) quantifies the actual vertical accuracy achieved — the number that goes in the accuracy report delivered with the final products.
Stage 5: Derived Products
From the DEM, a series of analytical products are generated:
Contour lines at specified intervals, smoothed to remove artifacts while preserving terrain fidelity.
Slope map showing steepness at every pixel, used for erosion risk assessment and infrastructure design.
Hillshade visualization that makes terrain features intuitive to non-technical stakeholders.
Flow direction analysis computing the path water takes from every point on the surface.
Flow accumulation identifying where water concentrates, revealing natural drainage networks.
Watershed delineation defining the boundaries of contributing catchment areas for any point of interest.
These derived products are not independent analyses — they are mathematical transformations of the DEM, each revealing a different aspect of the same terrain data.
Stage 6: Hydrological Analysis and Simulation
This is where data becomes intelligence.
Using the DEM and its derived products as inputs, hydrological analysis evaluates how the terrain manages water:
Problem identification: Where does water accumulate? Where does it flow in ways that cause damage? Where are the bottlenecks in natural or built drainage systems?
Structure evaluation: For existing infrastructure — ponds, channels, culverts, detention basins — does the terrain data explain why they are performing as they are? Is a pond undersized relative to its actual catchment? Is a channel route fighting the natural slope?
Scenario modeling: For proposed improvements, rainfall simulation shows how the terrain performs with different interventions in place. What happens if you add a bund here? Resize a culvert there? Regrade this section?
This analysis is where domain expertise is essential. The software computes hydraulics; the analyst interprets results, identifies the significant findings, and formulates recommendations that are practical and buildable.
Stage 7: Reporting and Delivery
The final stage packages everything into a deliverable that the client can use:
Data files: Classified point cloud (LAS/LAZ), DEM (GeoTIFF), contours (shapefile/DXF), and all derived raster products, delivered in the client's coordinate reference system.
Analysis report: A written document that presents findings in plain language with annotated maps. What problems were identified, where are they, how severe are they, and what should be done about them. Specific recommendations with specific locations — not general suggestions.
Presentation-ready maps: Print-quality figures suitable for engineering meetings, council presentations, or donor reports. These are often the most-used deliverable — the maps that travel through an organization and drive decision-making.
The complete pipeline, from flight to final delivery, typically takes 48 to 72 hours for standard projects and up to two weeks for large or complex analyses. The timeline depends primarily on the extent of hydrological analysis and the complexity of the recommendations report.
Why the Pipeline Matters
Every stage of this pipeline contributes to the final product quality. Shortcuts at any stage — poor classification, rough interpolation, superficial analysis — propagate through to the deliverable.
Understanding the pipeline also helps clients evaluate provider quality. A company that can explain their processing methodology in detail is one that has invested in developing and refining that methodology. A company that treats processing as a black box is often cutting corners you can't see until the data proves inadequate for your application.